一,matplotlib是什么
在python中用于数据库可视化的2D绘图库。
二,安装
http://matplotlib.org/users/installing.html
三,交互模式与非交互模式
1,非交互模式
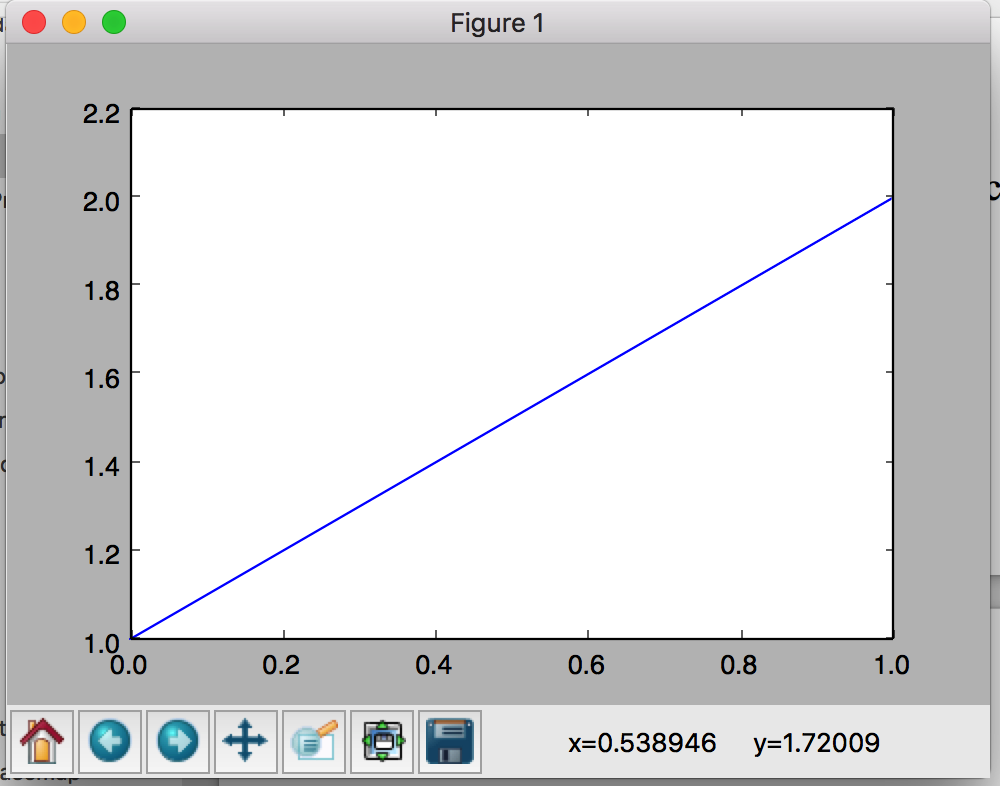
在python shell里面执行
import matplotlib.pyplot as plt
plt.plot([1, 2])
plt.show()
执行show之后会打开一个GUI窗口显示,同时交互命令会阻塞。

2,交互模式
matplotlib.is_interactive()可以查看当前是否在交互模式;
matplotlib.pyplot.ion()用于打开交互模式;
matplotlib.pyplot.ioff()用于关闭交互模式;
import matplotlib.pyplot as plt
plt.ion()
plt.plot([1, 2])
执行plot之后打开了一个GUI窗口,交互命令没有阻塞,继续执行:
plt.plot([2, 3])
可以看到在窗口里面再画了一条线。
也就是在非交互模式,需要一次画好再调用show显示;而交互模式在每次绘制后都能实时看到效果。
3,ipython的magic command
在ipython的%matplotlib也可以打开交互模式。
在交互模式中如果某些修改没有自动刷新,可以调用matplotlib.pyplot.draw()刷新。
四,在jupyter notebook中使用matplotlib
1,%matplotlib
以交互模式打开独立的GUI窗口,对同一个figure的绘制都自动刷新到对应的GUI窗口。
2,%matplotlib notebook
同%matplotlib,只是会将GUI窗口嵌入到cell的输出。

3,%matplotlib inline
将绘制的图转换为静态图片嵌入到cell的输出。在不同的cell进行绘制效果不会叠加。

五,figure的各个组成部分
http://matplotlib.org/faq/usage_faq.html#parts-of-a-figure
六,matplotlib的两种绘图接口
1,matlab风格接口
所有的plt命令都会应用到自动创建的“当前”的figure和axes对象。使用plt.gcf和plt.gca获取“当前”的figure和axes。
调用plt.plot([1, 2])即绘制到自动创建的figure和axes。
plt.plot([1, 2])
plt.plot([2, 1])
2,面向对象接口
显式获得绘制对象,在特定对象执行相应操作。
fig, ax = plt.subplots()
ax.plot([1, 2])
ax.plot([2, 1])
3,差别
对于简单绘制两种接口的差别不大,复杂情况面向对象接口会更合适。
另外plt的很多函数都可以直接转为ax的函数,例如plt.plot() -> ax.plot(),但某些会有差别,例如plt.xlabel() -> ax.set_xlabel()。
七,各类图形demo
http://matplotlib.org/gallery.html
八,API
http://matplotlib.org/api/index.html
参考:
1,http://matplotlib.org/index.html#
2,http://matplotlib.org/faq/usage_faq.html#what-is-interactive-mode
3,http://jupyter.org
4,http://www.labri.fr/perso/nrougier/teaching/matplotlib/#introduction
5,http://nbviewer.jupyter.org/github/jakevdp/PythonDataScienceHandbook/blob/master/notebooks/04.00-Introduction-To-Matplotlib.ipynb#Two-Interfaces-for-the-Price-of-One