朋友的家人做生意,每日从各地分店处收集报表,然后回去汇总。由于不想用那种复杂的管理软件,就叫他写一个小工具。于是他找到了我,让我想想办法。
Python是个令人惊奇的工具,而不仅仅是一种语言。对比老牌的Perl,看似Python不是那么的精通 —— 对比Perl超快的文本处理速度和广泛应用于Cgi程序的编写历史,以及目前大红大紫的Ruby在Web开发上的病毒式蔓延,而比起静态语言比如C\C++,虚拟机Java和C#来说,速度又成了问题。但是Python的实力可不容小视,NASA都用Python可不是吹的,况且,Python的学习难度比Perl小多了,刚学时让我找到了以前QBASIC的感觉。
此程序具体要求如下:每日产生副表若干(如副表文件)。程序先核对附表的日期和销售点。如果销售点不同日期相同,便把不同副表的相同产品号的 “销售数量”栏相加,填入总表“销售数量”栏。将副表的“总利润”栏相加填入总表的“总利润”栏。其他副表信息复制到总表(备注除外,由用户自行处理)。表头的样式如下:
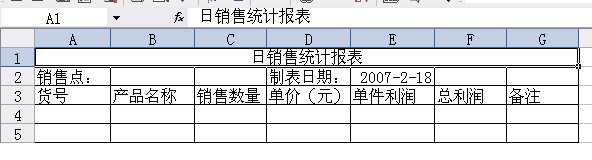

啊哈,很简单的表头。其中需要操作的是“销售数量”和“总利润”,也就是把相同时间的报表相加。但是这样有个严重问题!
必须要求,相同报表的产品名称、货号的顺序不能出错,各地要绝对统一,否则全部这样照样拷贝就会出错!
让我们分析一下思路:时间是关键。时间决定了哪些报表需要分门别类,生成哪一天的统计总表。数据结构上,用什么呢?简单的list?不行,我尝试过。应该使用map容器,把日期作为key,储存的Value是个列表。程序先扫描所有的Excel文件获取日期,然后把相同日期报表的COM文档接口储存起来,实现了分门别类。最后遍历这个map容器,计算,生成每日的统计总表。代码如下,经过测试正常。
1 import os;
2import sys;
3import time;
4import datetime;
5#请先安装对应着你自己的Python版本的PythonWin32
6import win32com.client;
7
8
9mapper = {};
10
11app = win32com.client.Dispatch("Excel.Application");
12PipeOut = os.popen("dir *.xls /B");
13FileList = PipeOut.readlines();
14PipeOut = os.popen("cd");
15CurDic = PipeOut.readline();
16CurDic = CurDic[:-1] + "\\";#去处末尾的\n
17print "当前工作目录为"+CurDic;
18
19 #读取每个文件的时间和储存相应的COM接口
20
21for filename in FileList:
22 filename = CurDic+filename[:-1];
23 print filename;
24 Doc = app.Workbooks.Open(filename);
25 Sheet = Doc.Sheets(1);
26 Time = Sheet.Cells(2,5);
27 print type(Time);
28 TimeKey = str(Time);
29 print TimeKey;
30 if mapper.has_key(TimeKey):
31 mapper[TimeKey].append(Sheet);
32 else :
33 mapper[TimeKey] = [];
34 mapper[TimeKey].append(Sheet);
35 #print mapper;
36
37
38 #生成新的统计总表
39
40 #开始处理mapper 每次从一个自表中读取2x20个数据,然后和总表相加
41print "-------------------------------------";
42Protetype = [0,0,0,0,0,0,0,0,0,0,0,0,0,0,0,0,0,0,0,0];
43a = 0;
44b = 0;
45c = 0;
46
47for k,v in mapper.items():
48 print "//////////////////////////////////"
49 a+=1;
50 Count = [0,0,0,0,0,0,0,0,0,0,0,0,0,0,0,0,0,0,0,0];
51 Benefit = [0,0,0,0,0,0,0,0,0,0,0,0,0,0,0,0,0,0,0,0];
52 Name = [u"",u"",u"",u"",u"",u"",u"",u"",u"",u"",u"",u"",u"",u"",u"",u"",u"",u"",u"",u""];
53 #print Count;
54 #print Benefit;
55 #Total = app.Workbooks.Open(CurDic+"Template\\TotalTemplate.xls");
56 print "How manu Sheets in this List ? ",len(v);
57 for sht in v:
58 b+=1;
59 _Count = sht.Range("C4:C23").Value;
60 _Benefit = sht.Range("F4:F23").Value;
61 _Name = sht.Range("B4:B23").Value;
62 #print _Count;
63 #print _Benefit;
64 assert(len(_Count) == len(_Benefit));
65 for i in range(0,len(_Count)):
66 c+=1;
67 Count[i] = _Count[i][0] + Count[i];
68 Benefit[i] = _Benefit[i][0] + Benefit[i];
69 Name[i] = _Name[i][0];
70 #以上作为储存总表项的数据
71 Total = app.Workbooks.Open(CurDic+"Template\\TotalTemplate.xls");
72 TotalSheet = Total.Sheets(1);
73 _Time = k[:k.find(" ")];
74 _Time = _Time.replace("/","-");
75 print _Time;
76 print Count;
77 print Benefit;
78 #TotalSheet.Cells(2,2).Value = _Time;
79 for i in range(0,len(Count)):
80 TotalSheet.Cells(4+i,3).Value = Count[i];#填充数量
81 TotalSheet.Cells(4+i,6).Value = Benefit[i];#填充利润
82 TotalSheet.Cells(4+i,2).Value = Name[i];#填充货物名称
83
84 #保存总表
85 Total.SaveAs(CurDic+_Time+"统计总表.xls");
86 del Count,Benefit;
87print "++++++++++++++++++++++++++++"
88print a,b,c;
89app.Quit();
90app = None;
91 使用方法,先安装Python 2.4和PythonWin For 2.4。然后把这个脚本拷贝到分表的文件夹下,然后运行(调试),自动生成与日期相关的总表。效果图如下:
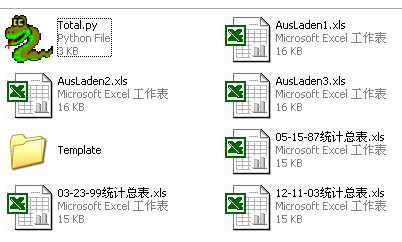
最终解决思路的提示:其实这种方法只能在规模比较小的时候,因为这种脱离于总系统的处理效率实在非常低,而且Excel二进制文件,空表的占用就达15k,在未来有大量业务数据处理的话将是无法忍受的噩梦。所以,我建议这位商务人士分析一下他所使用的处理系统,用便宜的网络线路构建从各地中心服务器系统,使用XML作为数据交换得媒介,在自己的服务器上您只需要使用简单的SQL处理过程就可以了,而且数据的可靠度比平面Excel文档高得多。
数据在这里下载,为了保险起见请不要使用中文的文件夹目录。
posted on 2007-02-21 12:37
周波 阅读(2675)
评论(2) 编辑 收藏 引用 所属分类:
无庸技术 、
奇思妙想